
Uncovering Energy Patterns: Building Energy Usage in Seattle for Sustainable Solutions
Uncovering Energy Patterns: Building Energy Usage in Seattle for Sustainable Solutions
Abstract:
The issue of building energy consumption and its environmental impact in Seattle is a pressing concern. This research, based on Seattle’s Building Energy Benchmarking Program, aims to address the problem by developing a sophisticated model that can accurately analyze and forecast energy consumption patterns in various city buildings in Seattle. The study utilized the combination of supervised and unsupervised learning methods such as linear regression, clustering, and dimensionality reduction to discover underlying trends, patterns, and insights hidden in the large data set. By gaining a deep understanding of the dynamics of energy use, the research actively aims to promote sustainable practices, improve informed decision-making, and effectively reduce the environmental impact of building energy use in Seattle in real-time.
Introduction:
In the modern world, energy use in buildings and its impact on the environment are significant concerns. The objective of this study is to address the issue by utilizing the data from Seattle’s building Energy benchmark program which collects data every year. In this case study, we will utilize the 2021 Building Energy Benchmarking data by considering various factors such as demographic information, floor size, parking area and year built of the buildings in Seattle. The goal is to develop a model that can accurately assess and forecast trends of energy usage in buildings, considering the necessity for timely and effective solutions. By gaining a deeper understanding of energy consumption, we aim to contribute to the development of sustainable practices, inform decision-making processes, and mitigate the environmental impact caused by building energy consumption in Seattle.
Theoretical Background:
It’s important to note that the PCA assumes linearity in the dataset and may not be suitable for non-linear relationships. PCA can be used to visualize the data in lower dimensions and fill in missing information in the dataset.
SVD stands for Singular Value Decomposition, which is a mathematical technique used for matrix factorization. It decomposes a matrix into three separate matrices, allowing valuable information about the matrix’s structure and properties.
Given an m x n matrix A, the Singular Value Decomposition factorizes it into three matrices:
A = U Σ V^T
where:
- U is an m x m orthogonal matrix, whose columns are called the left singular vectors of A.
- Σ is an m x n diagonal matrix, with diagonal entries known as the singular values of A. The diagonal elements are arranged in descending order.
- V^T is the transpose of an n x n orthogonal matrix V, whose columns are called the right singular vectors of A.
PCA is equivalent to SVD when the data is pre-scaled in the SVD decomposition. Hence, SVD can be used to reduce the dimensionality of a dataset by selecting the top k singular values and their corresponding singular vectors. This technique is especially useful for large datasets and can help with noise reduction and extracting the most informative features. SVD can reveal the most common directions or qualities the data have.
An unsupervised learning technique called clustering is used to put comparable data points together based on their inherent properties. Clustering algorithms look at the data to find clusters or groupings of data points that share characteristics. The k-means algorithm is one clustering algorithm that is frequently utilized. In the k-means algorithm, the number of clusters to divide the dataset into needs to be specified. The algorithm starts by randomly assigning each data point to a intital cluster. It then iterates over each cluster, computing the centroid of each cluster, and reassigns the data points to the cluster based on the closest Euclidean distance to the centroid.
The k-means algorithm is sensitive to initialization, as it can find local minimum instead of the global minimum. To mitigate this issue, the algorithm can be run multiple times, and the version that yields the minimum cluster distance can be selected. The choice of the number of clusters is subjective and depends on the user’s requirements and how the data is grouped within each cluster.
It is significant to note that PCA (Principal Component Analysis) and k-means both perform well with numerical data. The distance between data points and centroids is often measured using the Euclidean distance, and the data must be presented in a numerical manner. The within-group sum of squares is also influenced by the number of clusters selected, with more clusters leading to a smaller within-group total of squares. However, utilizing k-means to investigate various cluster alternatives can be computationally expensive, particularly for large datasets. Hierarchical clustering might be thought of as an alternate strategy in these situations. An unsupervised learning process called hierarchical clustering divides related data points into clusters according to how similar or dissimilar they are. Either top-down (divisive) or bottom-up (agglomerative), it builds a hierarchy of clusters. One advantage of hierarchical clustering is that it does not require a predefined number of clusters and it can be less time-consuming. It operates based on similar principles as the k-means algorithm.
Methodology:
In this case study, an analysis was conducted on the “2021 Building Energy Benchmarking dataset” obtained from Seattle City’s Open Data Portal. The dataset supplies information on the energy performance and consumption of residential and multifamily buildings. Initially, the dataset had few records, but it had many derived columns. Selecting the right columns for the analysis required careful consideration and took some time. To identify the relevant features, a linear correlation metric was utilized, and any columns exhibiting a correlation above 0.8 were eliminated from the dataset (refer to Figure 1). The dataset included derived columns, such as SourceEUI(kBtu/sf), which were calculated by dividing energy consumption by floor area. These columns were also removed from the analysis.
In this case study, the focus was on using columns that were measured in British thermal units (kBtu) instead of columns that measured energy consumption in kilowatts (kW).
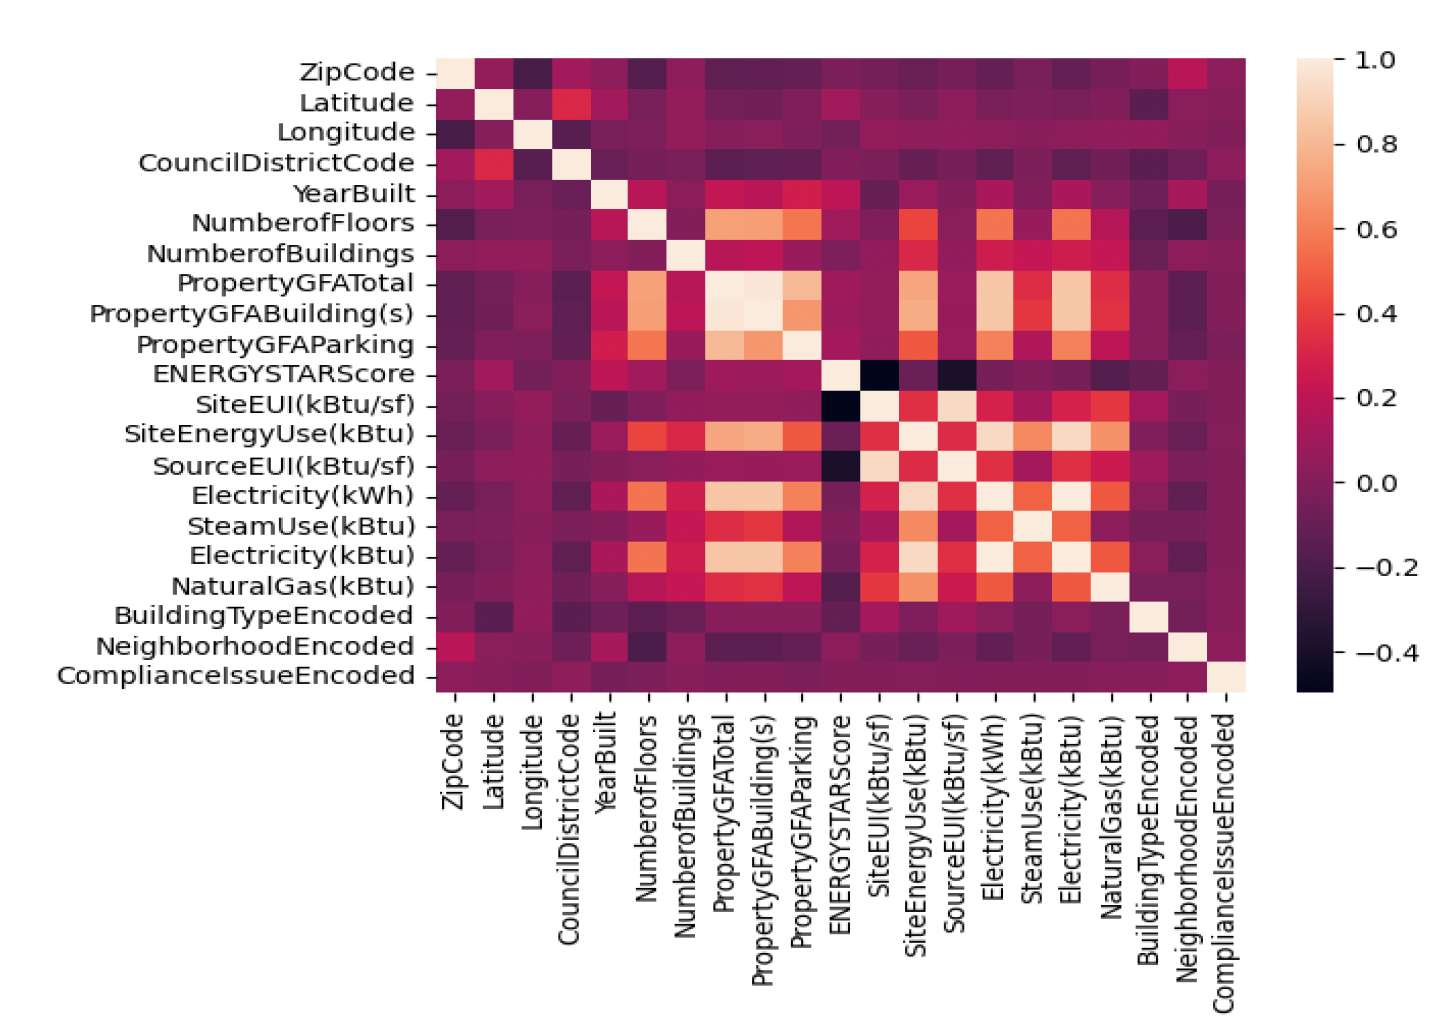 Figure 1: Correlation between various columns Next, the challenge was to address and analyze the missing data in the dataset. The pattern of missing values (Figure 2) revealed that the data was not missing at random. There’ a relation between missing values for the SiteEUI, SiteEnergyUser and SourceEUI column. The MICE (Multivariate Imputation by Chained Equations) technique was employed to replace the null values, ensuring that the analysis was based on complete data. This approach aimed to provide accurate predictions of energy consumption for each building by considering all relevant factors and minimizing the impact of missing data.
It was also important to know how many values are missing for each of the columns. As you can see in figure 3 that the ENERGYStarScore account for 40% of the missing data. Hence, we decided to remove this column from the further analysis. 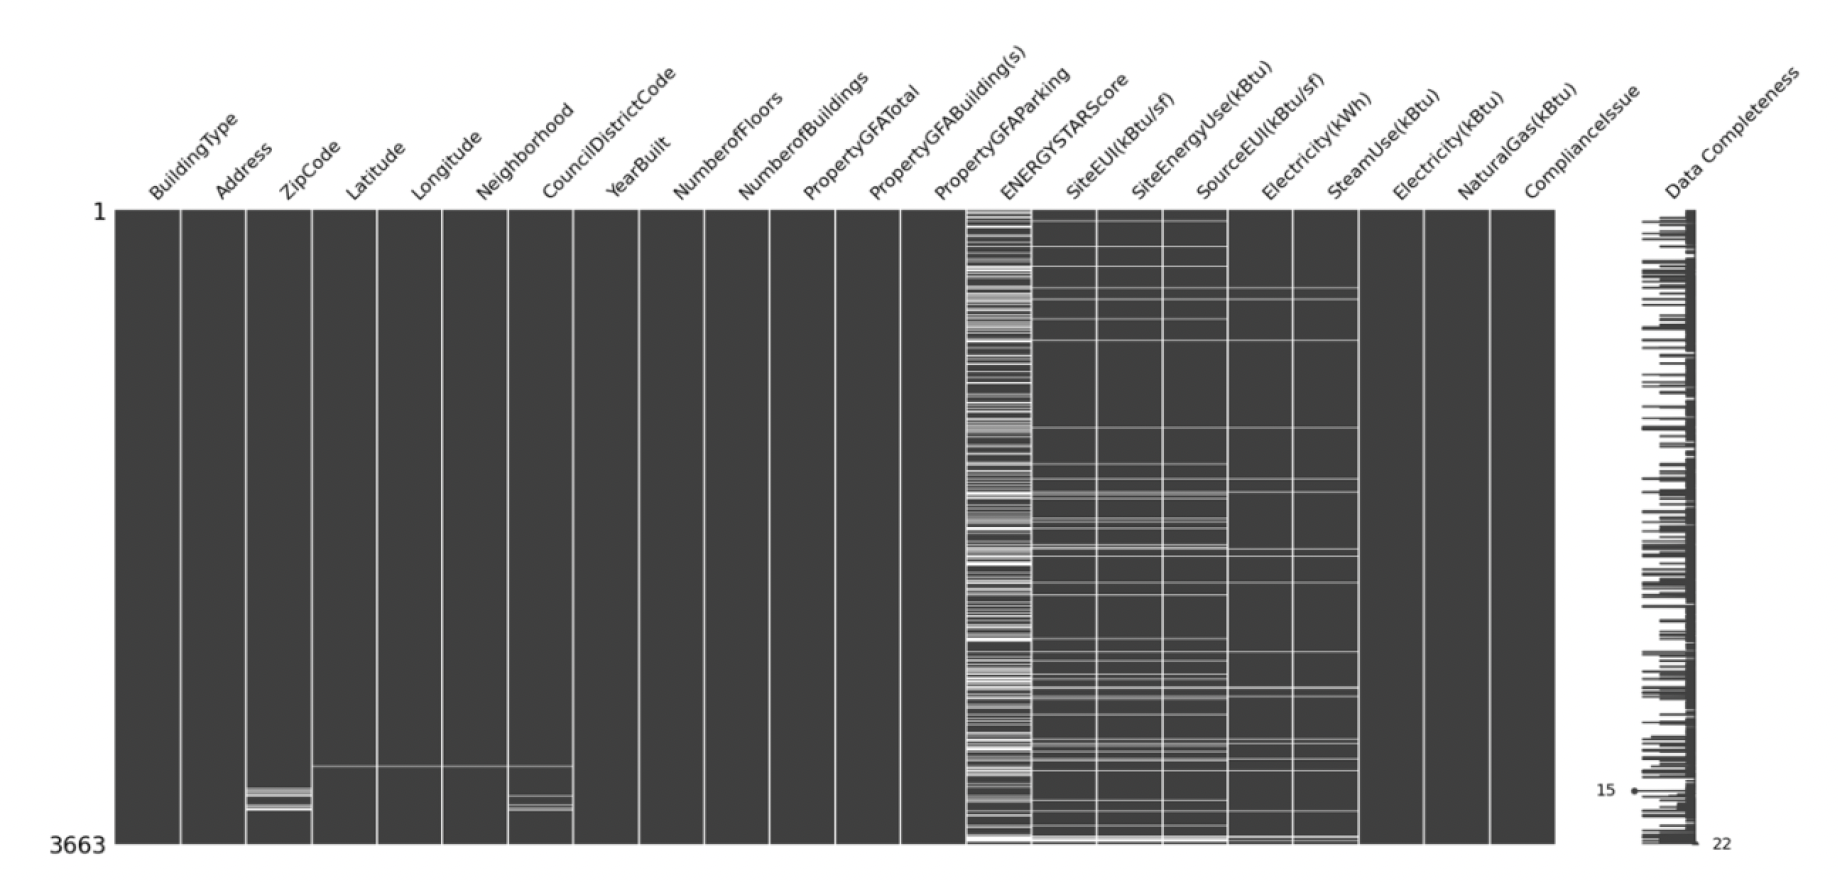 Figure 2: Missing records in the dataset
 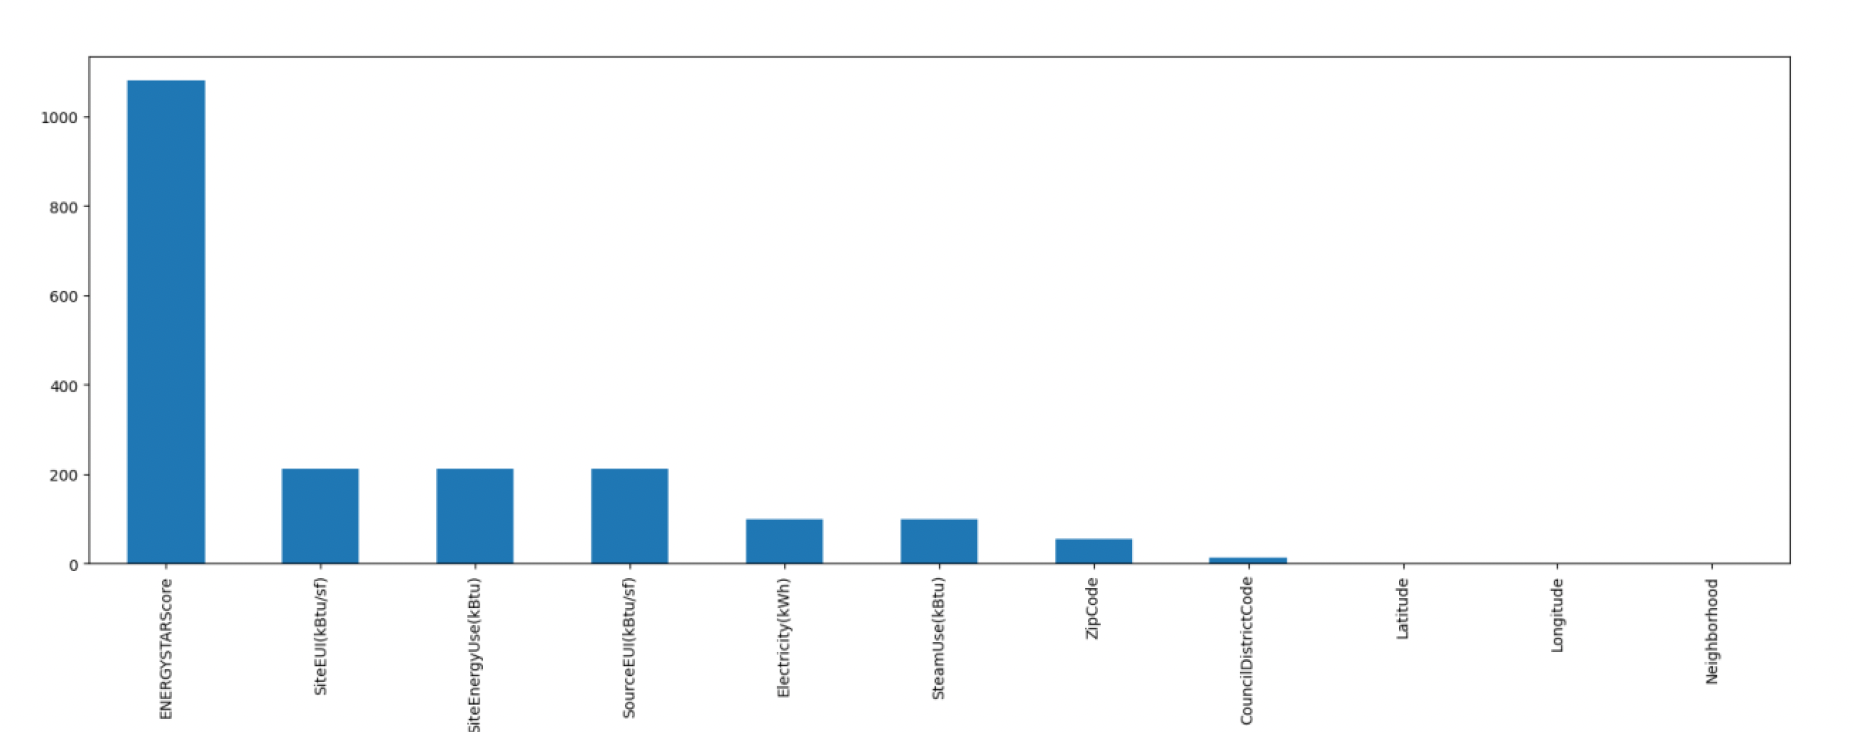 Figure 3: Number of null values for each column out of 3393 records.
The data was scaled after the preprocessing stage to enable an accurate prediction of energy consumption for each building in Seattle. The LazyPredict library was employed to predict the energy use, which use various models such as linear regression, support vector machines (SVMs), decision trees, and random forests. The following factors were considered for the prediction like the number of floors, building type, and demographic data. The model’s performance was assessed using evaluation metrics such as root mean square error (RMSE), R-squared, and modified R-squared.
Unsupervised machine learning techniques were used to find patterns in the dataset to broaden the scope of this case study. The PCA approach was employed to reduce the number of dimensions in the dataset after preprocessing the data. With the reduced-dimensional dataset, the K-means clustering algorithm was applied using 4 clusters to group similar buildings based on their energy performance and consumption characteristics. This clustering analysis facilitated the identification of distinct clusters representing buildings with similar energy usage patterns. The K-means algorithm assigned each building to one of the four clusters, providing insights into different energy consumption profiles across the dataset.
To visualize the clustering results and the relationships between variables, we constructed a dendrogram. The dendrogram displayed the hierarchical clustering structure, illustrating the similarity and dissimilarity between buildings based on their energy-related features. This visualization aided in the interpretation of the clustering results and provided a deeper understanding of the relationships between variables.
By combining PCA for dimensionality reduction, K-means clustering for grouping buildings, and the dendrogram for visualizing the clustering structure, we were able to uncover patterns and gain insights into the energy performance and consumption patterns of different types of buildings within the dataset. This extended methodology allowed us to explore the dataset from both a regression and clustering perspective, enhancing our understanding of the underlying patterns and relationships within the data.
Computational Results:
Supervised Learning: The objective is to predict the energy consumption of individual buildings or houses using various predictors such as the number of floors, square foot area, demographic information, and the year built. Various models were explored for energy consumption prediction. The Lazy Regressor Module from the LazyPredict library was utilized to evaluate the performance of multiple regression models using different metrics. The performance of the regression models was measured using metrics such as root mean squared error (RMSE) and adjusted R-square. The Linear Regression model yielded the best results, achieving an RMSE of 0.6. This model effectively predicted consumption based on the predictors like square foot area, demographic information, and parking area.
Furthermore, within the Linear Regression model, the importance of predictors was analyzed. By examining the coefficients or feature importance values, the predictors with the most significant impact on energy consumption prediction were identified. Refer to Figure 4 for the important features that contribute to the energy consumption of buildings. 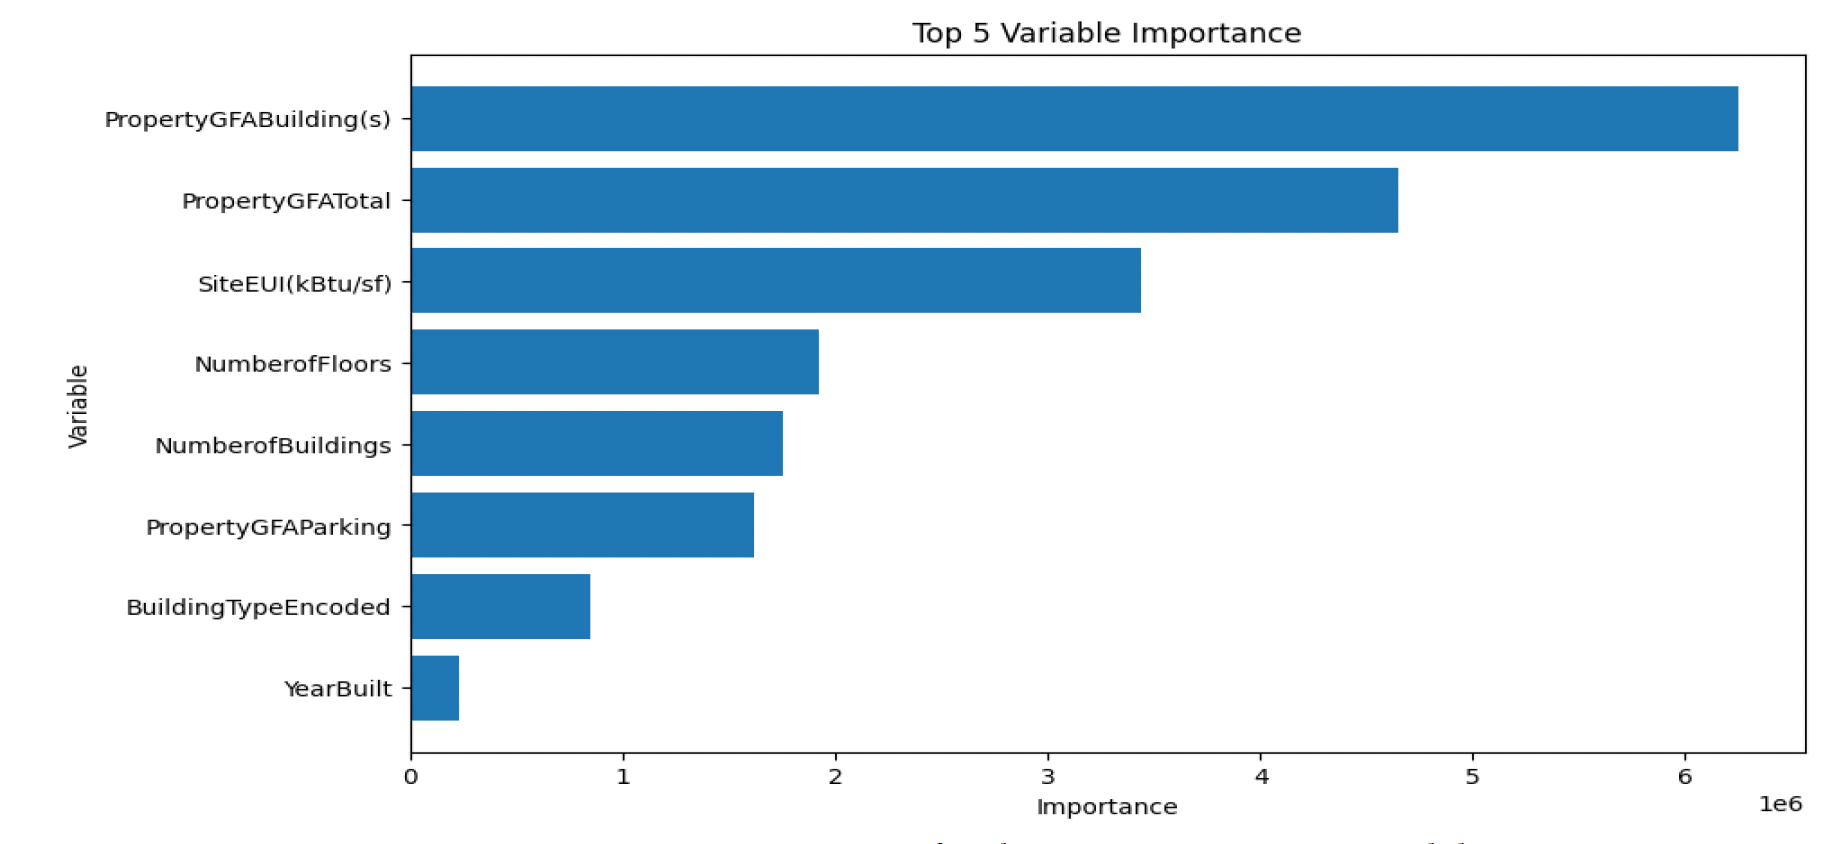 Figure 4: Feature Importance for the Linear Regression model
Unsupervised Learning: Principal Component Analysis (PCA) was utilized as a dimensionality reduction technique to uncover patterns in energy consumption within the dataset. The dataset was prepared by scaling it and then selecting relevant variables, ensuring they were in a suitable numerical format. Subsequently, PCA was applied to the dataset, transforming the original variables into a new set of uncorrelated variables known as principal components.
The algorithm identified underlying patterns and relationships between variables. After applying PCA, the explained variance ratio was computed to determine the proportion of variance captured by each principal component. This information guided the decision on how many principal components to retain. In this case, it is found out that 15 variables explained 95% of the variance, indicating that the reduced dataset containing these components retained most of the pertinent information. The reduced-dimensional dataset could help in analyzing and interpreting the patterns of energy consumption. The 15 principal components offered a consolidated representation of the original variables, enabling a focused exploration of relationships and patterns. Additionally, Figure 5, represents the visual aid, such as the explained variance ratio or another visualization related to the PCA analysis. It visually illustrates the contribution of each principal component to the overall dataset variance in figure 6.a and 6.b .
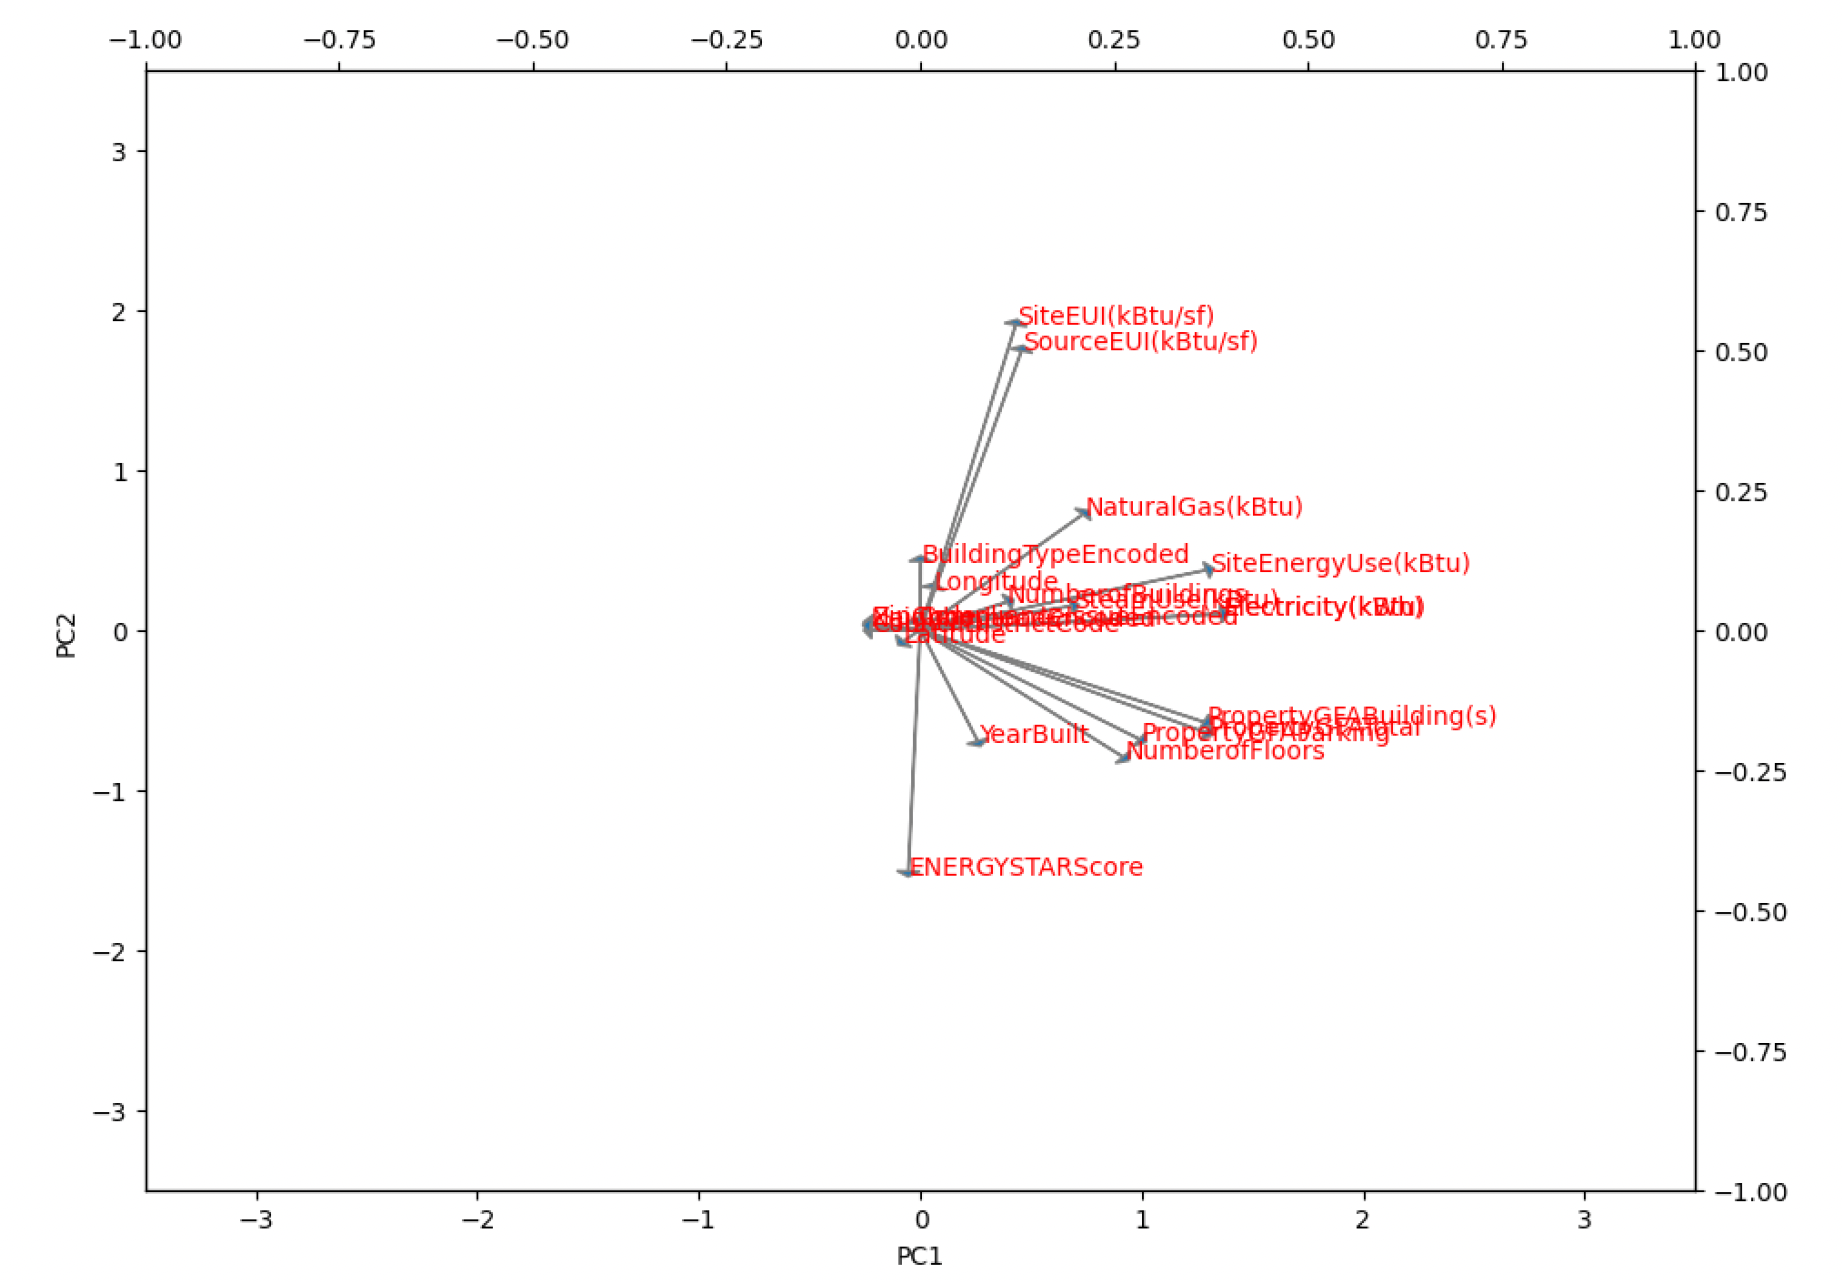 Figure 5: Reduced principal components.
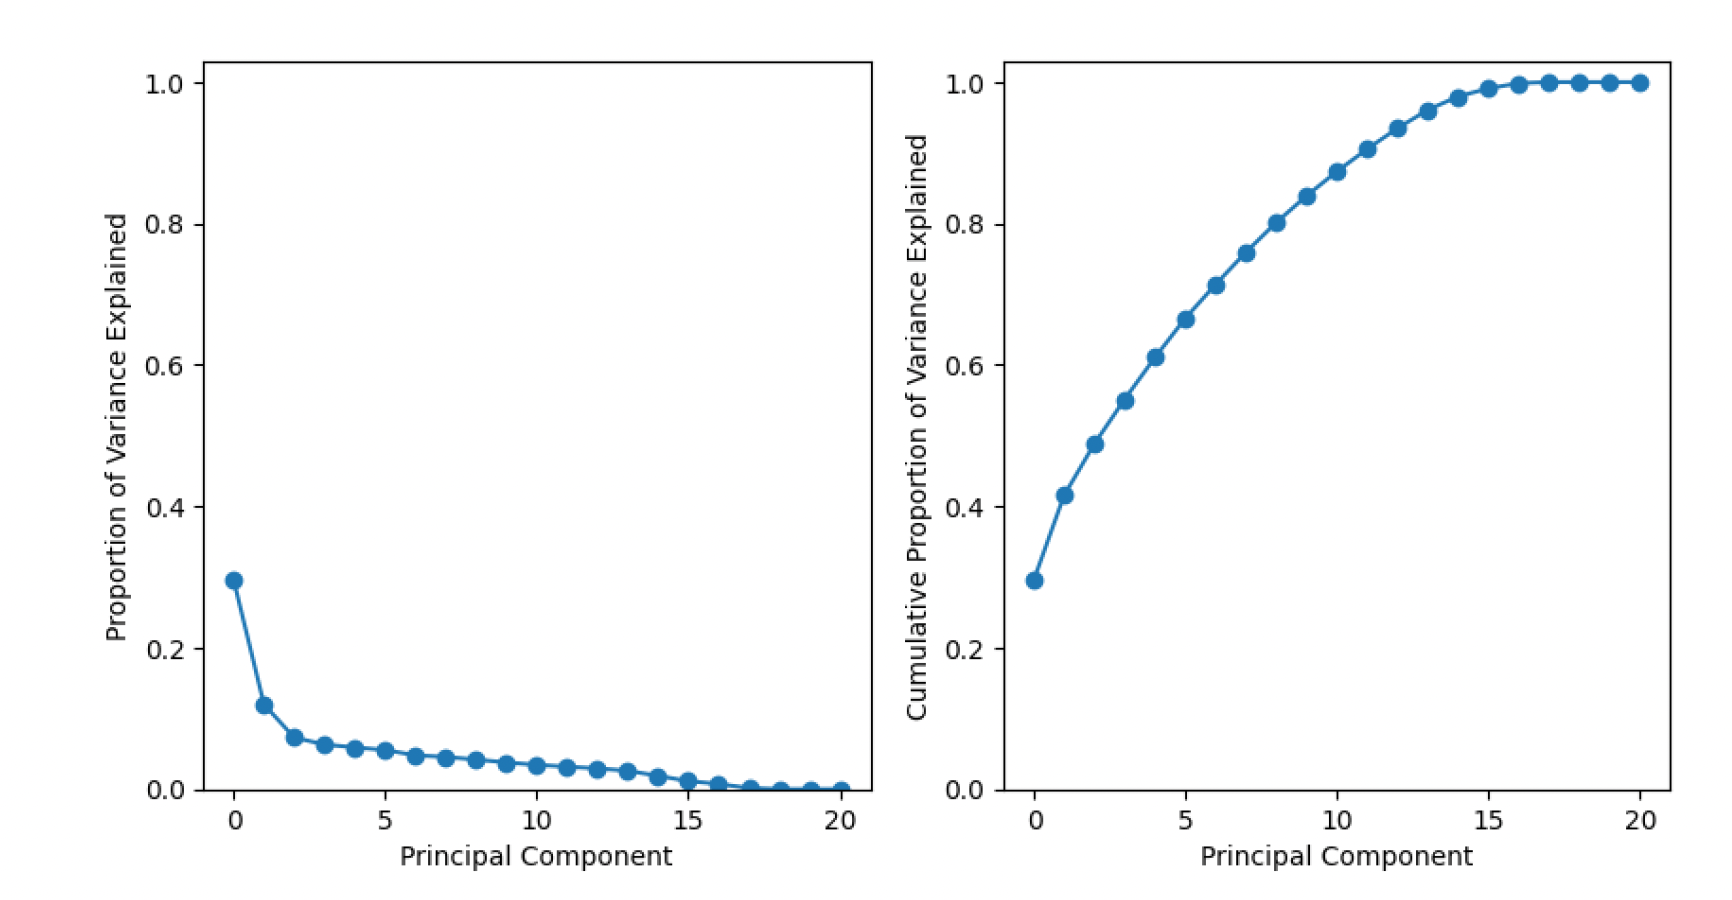 Fig 6.a: Proportion of Variance explained across component Fig 6.b: Cumulative Proportion of variance across each component
In Figure 7, the k-means clustering analysis was performed using four clusters. The clusters were determined based on the longitude and energy level consumption. It was observed that buildings with site energy consumption ranging from 0.1 to 0.2 fell into one cluster, while those with consumption from 0.2 to 0.4 formed another cluster. Similarly, buildings with consumption ranging from 0.5 to 1.4 were grouped into the third cluster, and those with consumption of 1.4 and above formed the fourth cluster.
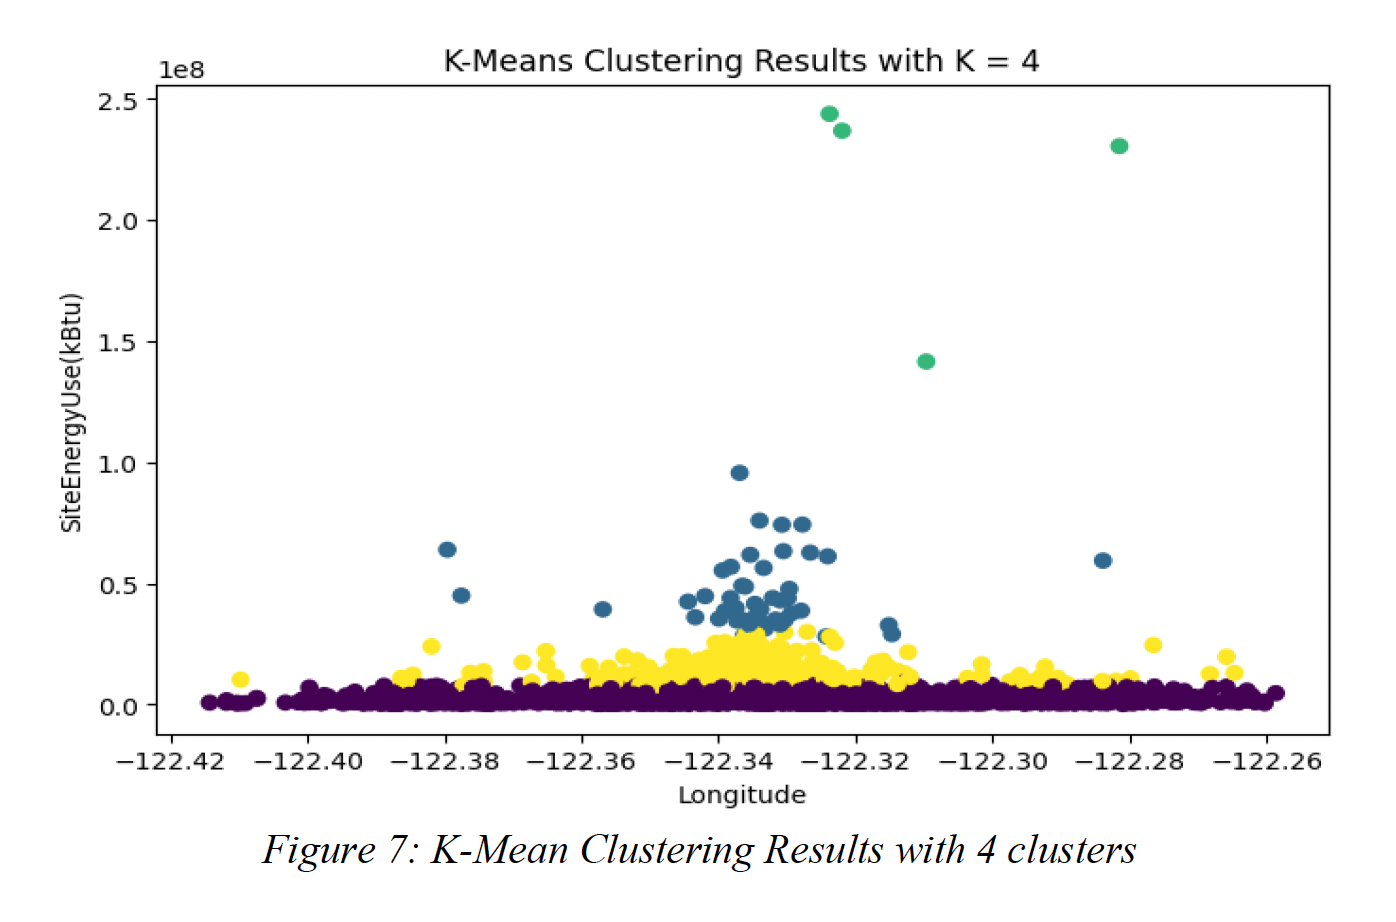 Figure 7: K-Mean Clustering Results with 4 clusters
In Figure 8, the clustering analysis was based on electricity and steam use. Buildings within a radius of 0 to 0.03 on both axes were assigned to cluster 1, while those beyond a radius of 0.23 on both axes belonged to cluster 2. For buildings falling within a radius of 1 on both axes for electricity and steam use, they were grouped into cluster 3. Finally, buildings that surpassed a radius of 1 on both axes were assigned to the fourth cluster. It is important to note that the units used in this analysis are in kBtu (British thermal units). 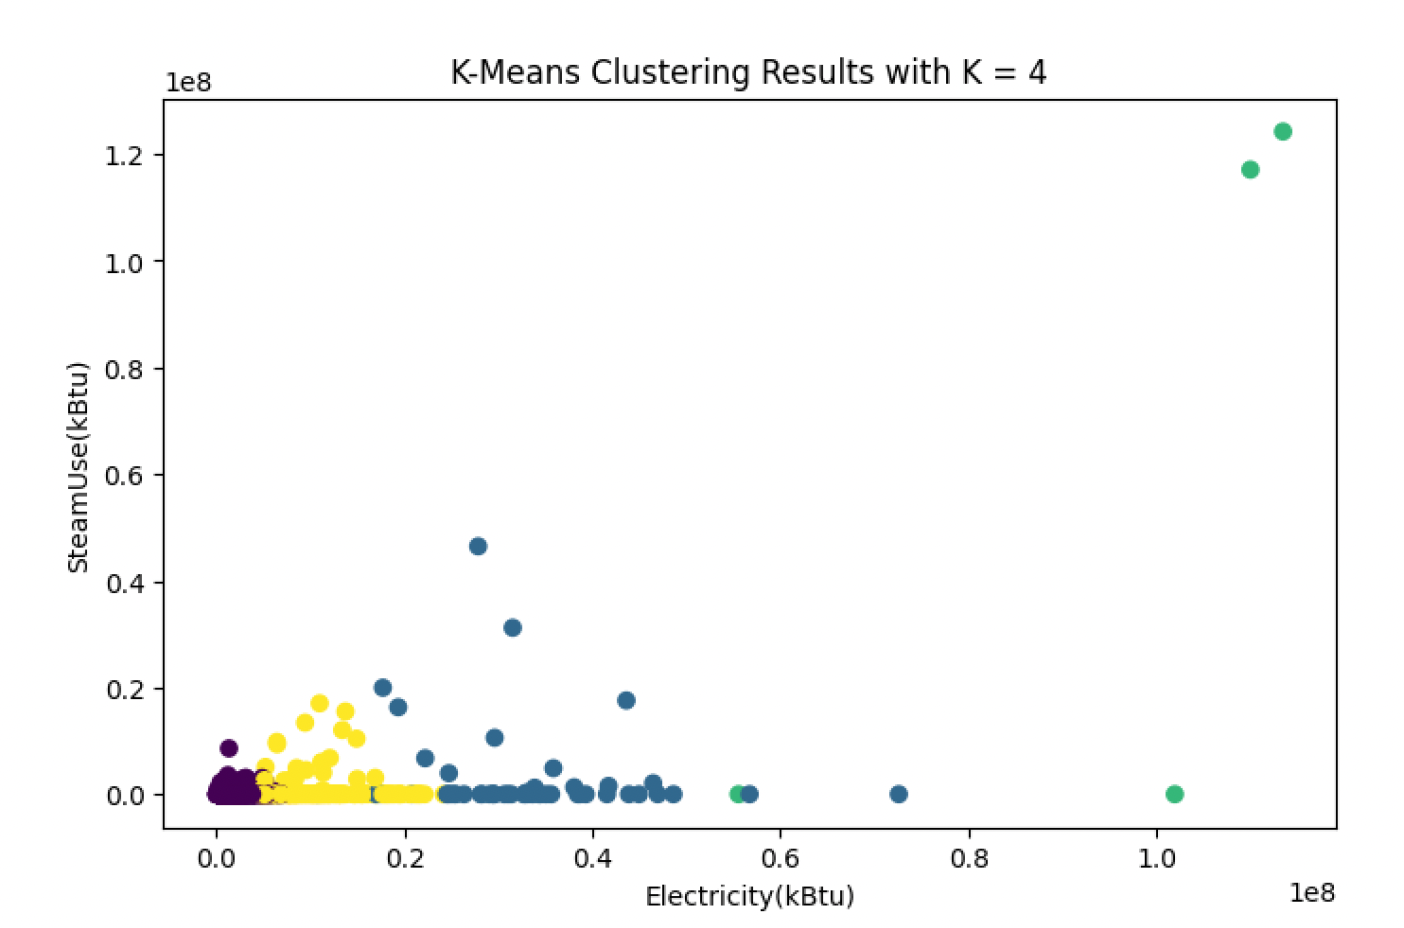 Figure 8: K means cluster with K = 4
Discussion:
The study applies dimensionality reduction and clustering as examples of unsupervised learning techniques to identify intriguing patterns and trends in the dataset. This analysis helps identify clusters or groups of buildings that exhibit similar energy consumption patterns. However, determining the optimal number of clusters for the k-means algorithm poses a challenge, as all possible numbers of clusters have equal variance. Careful consideration and analysis are required to select the appropriate number of clusters. During the analysis, we were able to distinguish data points based on variables like longitude and energy use per site, which played a primary role in clustering. Building type also emerged as an influential factor in grouping similar buildings based on their energy usage. By incorporating these factors into our analysis, we gain valuable insights into energy consumption patterns and can make informed decisions and recommendations tailored to specific building types and geographical locations.
The linear model emerged as the best-performing known model when applying supervised learning using the LazyRegressor module from the Lazypredict package. The development of a reliable approach for estimating energy usage based on input features enhanced the study by creating a predictive model for energy consumption. By combining the benefits of supervised and unsupervised learning, the research aims to promote sustainable behaviors, provide decision-making information, and minimize the environmental impact of building energy use in Seattle.
Overall, important insights and patterns in the dataset were discovered by combining the k-means algorithm with unsupervised learning techniques such as dimensionality reduction and clustering. Through the examination of relationships between building attributes, energy consumption, and geographical conditions, a better understanding of the complex dynamics influencing building energy use was obtained. This understanding enables well-informed recommendations for energy efficiency solutions and the reduction of the environmental impact of building energy usage in Seattle.
Conclusions:
In conclusion, this study used actual data from the city of Seattle to address the problem of building energy usage and its effects on the environment. Meaningful patterns and trends in energy usage were discovered by using unsupervised learning approaches, such as dimensionality reduction and clustering. Buildings were grouped together using K-means clustering and Principal Component Analysis (PCA) to identify separate groups that shared similar energy usage trends. The study allowed for a more complete understanding of the interactions between variables and revealed insights into various energy consumption profiles. In addition, energy consumption was predicted using supervised learning with the help of the linear regression model employing several factors such as Electricity consumption, Steam usage, number of floors, property building GFA, etc. Overall, this study contributes to the development of sustainable practices, informs decision-making processes, and aids in mitigating the environmental impact caused by building energy consumption in Seattle.
References:
2021 Building Energy Benchmarking dataset. Retrieved from the Seattle Open Data portal [ https://data.seattle.gov/Community/2021-Building-Energy-Benchmarking/bfsh-nrm6 ]
Authors